Overview
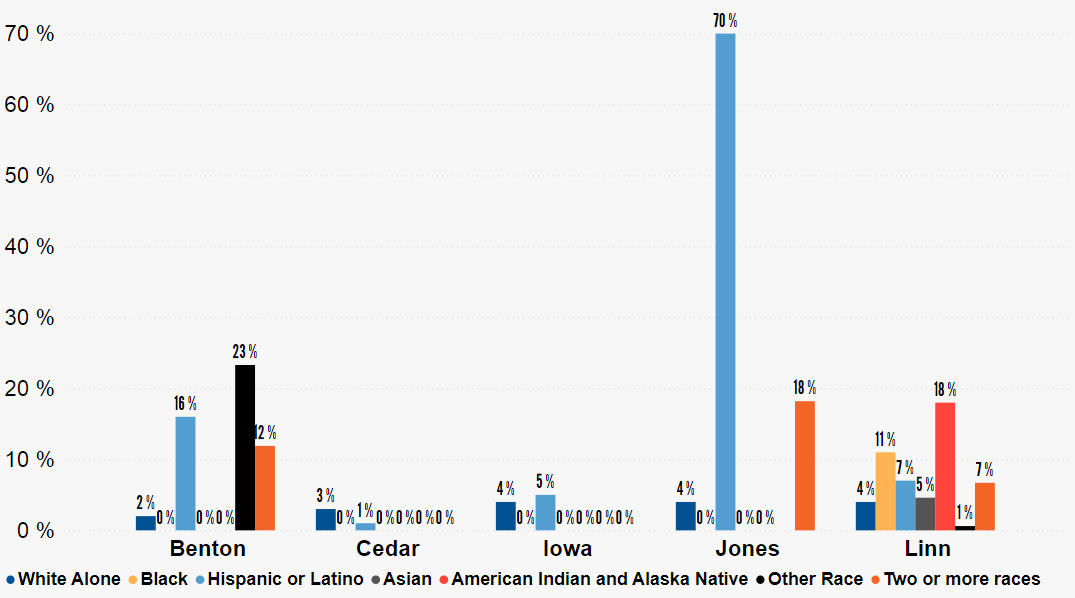
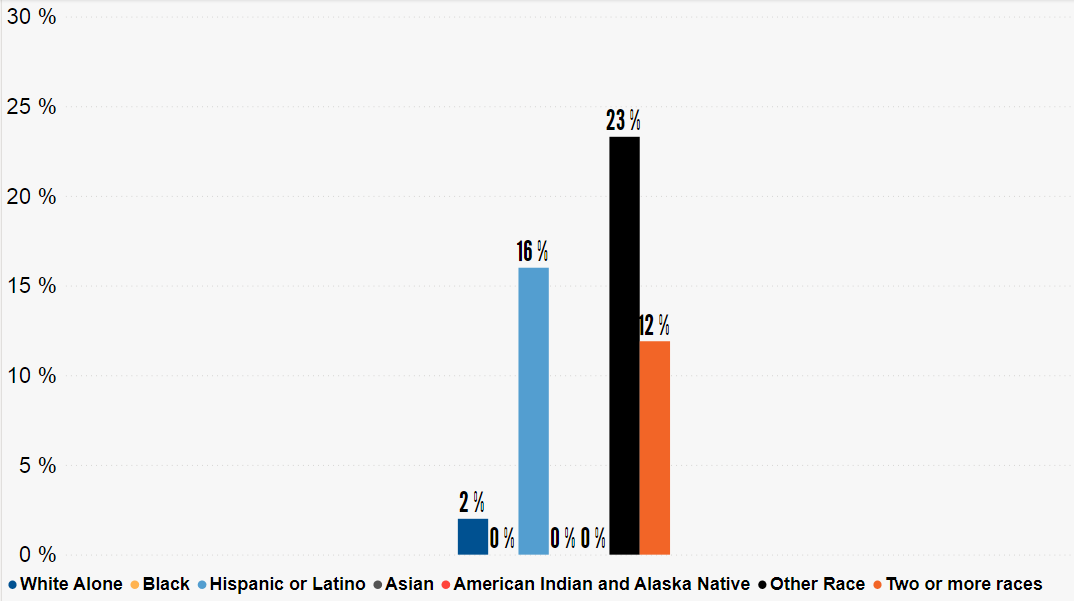
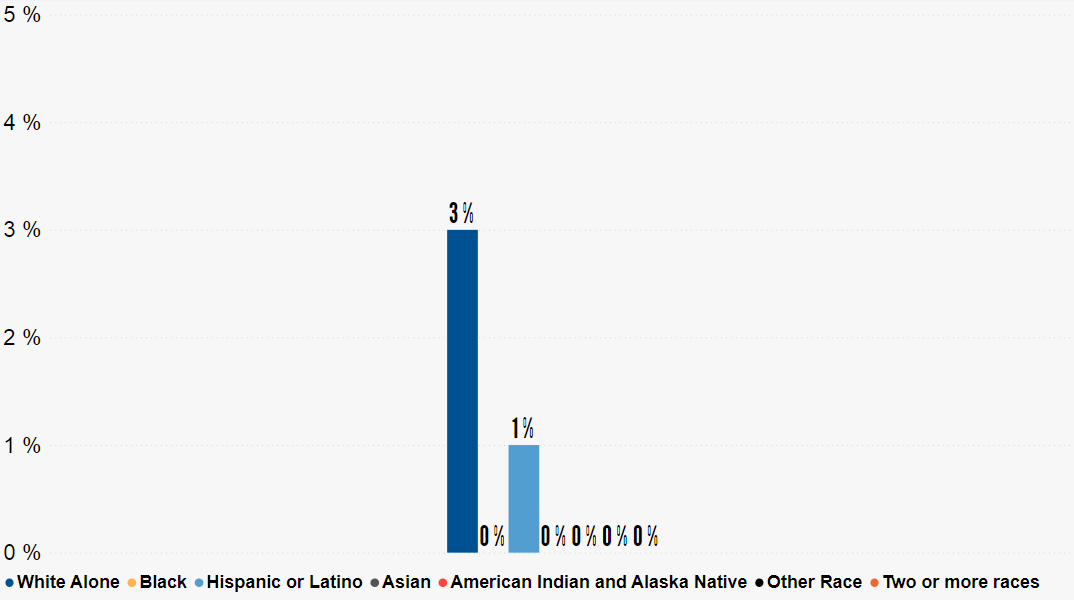
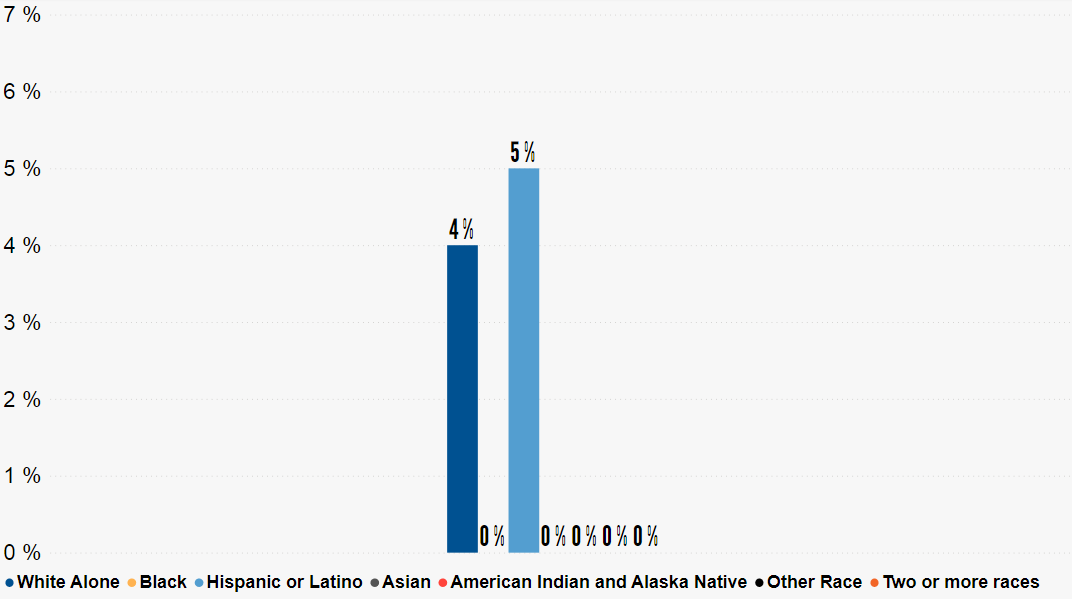
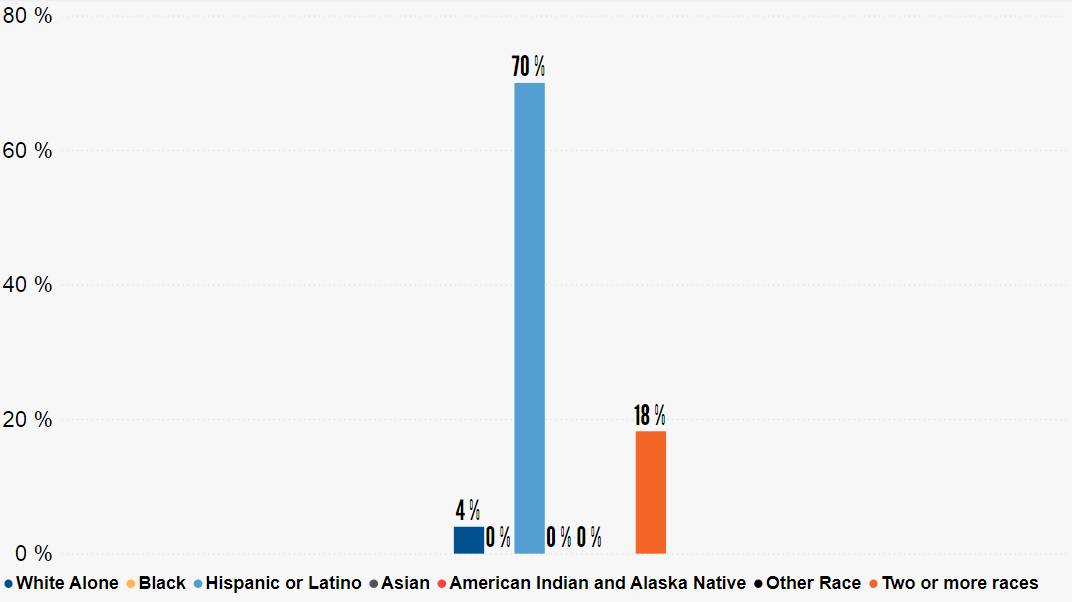
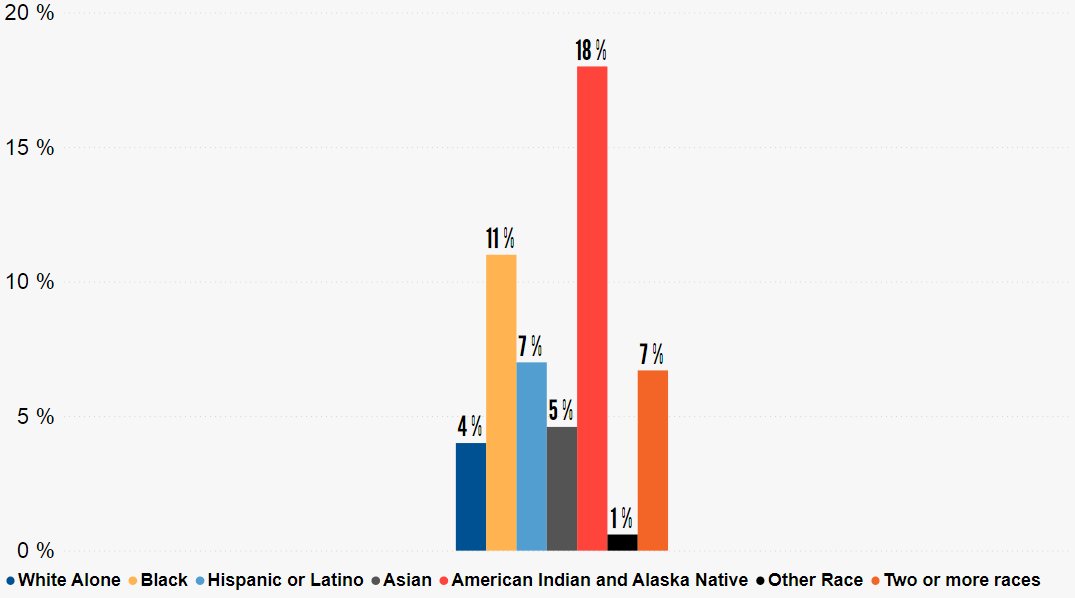
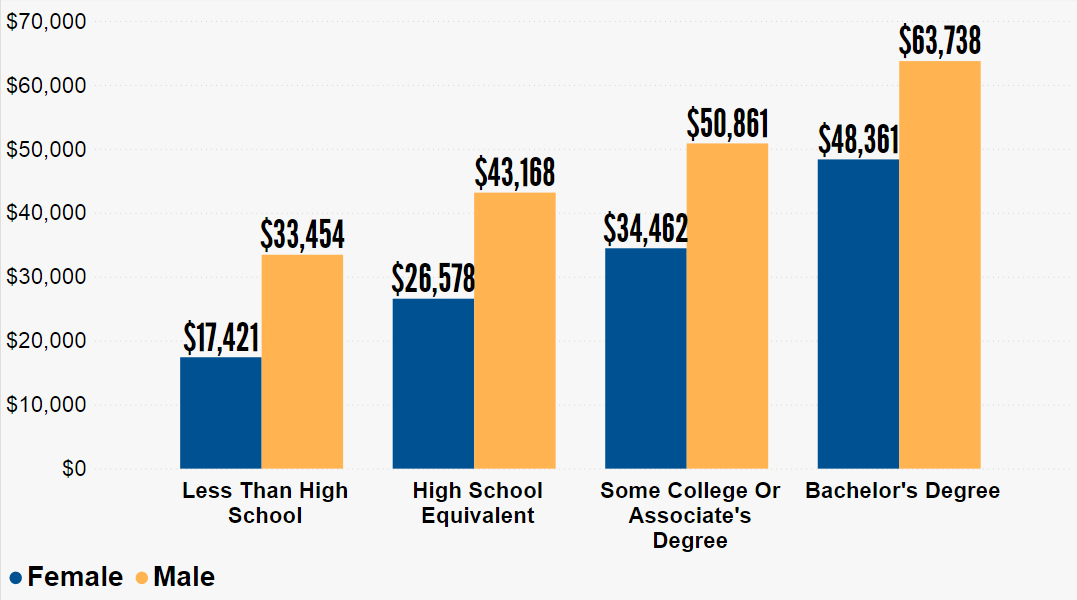
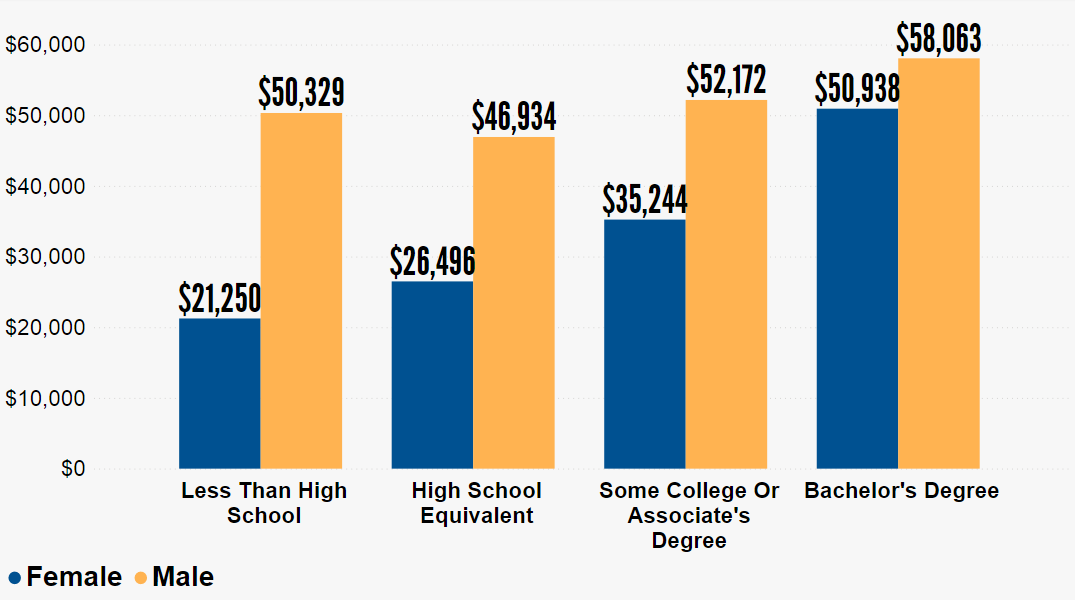
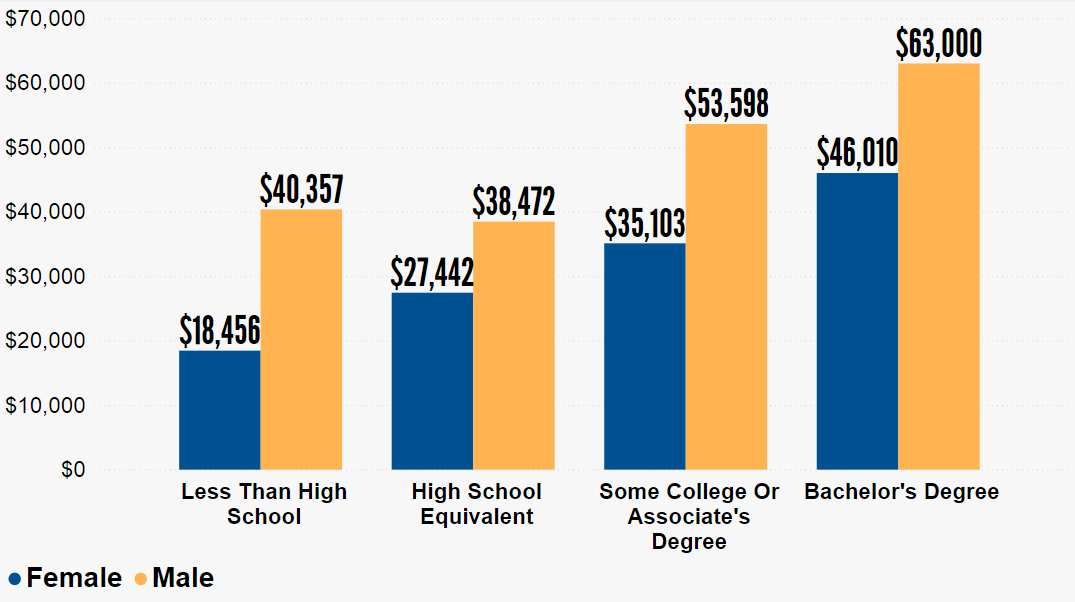
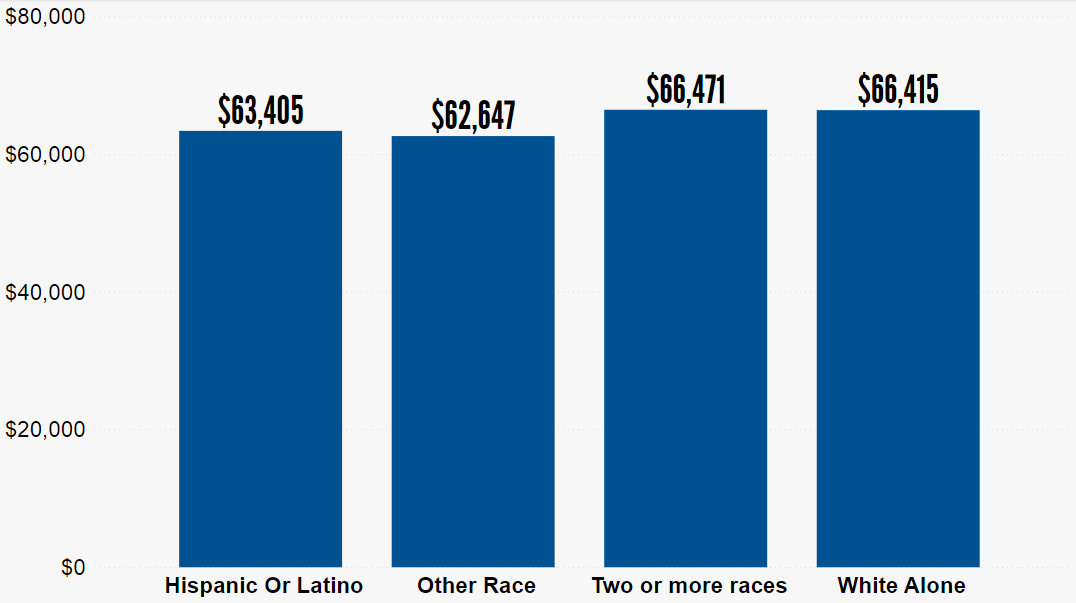
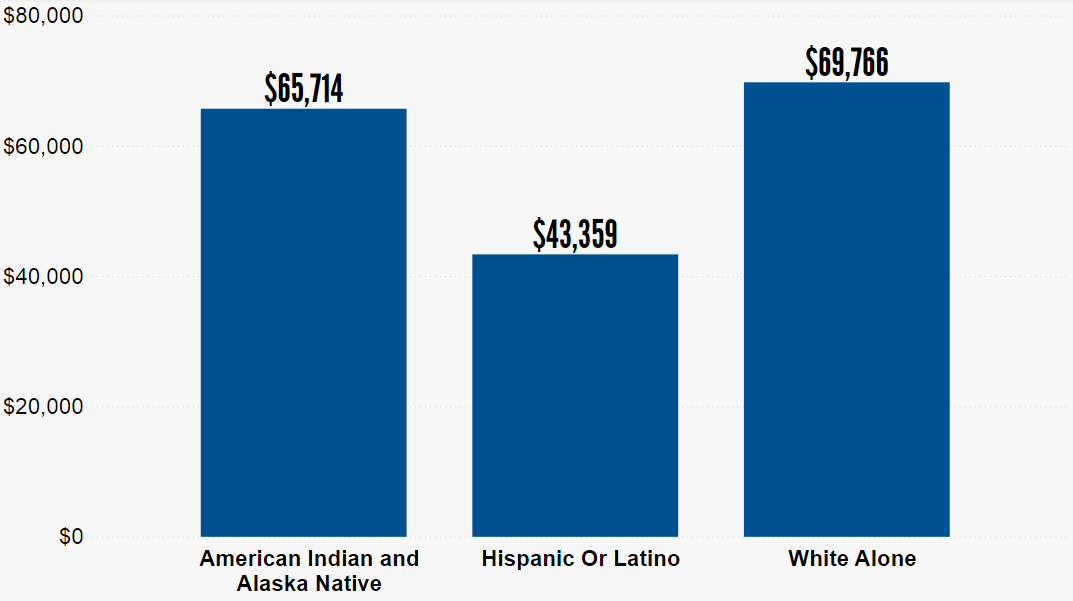
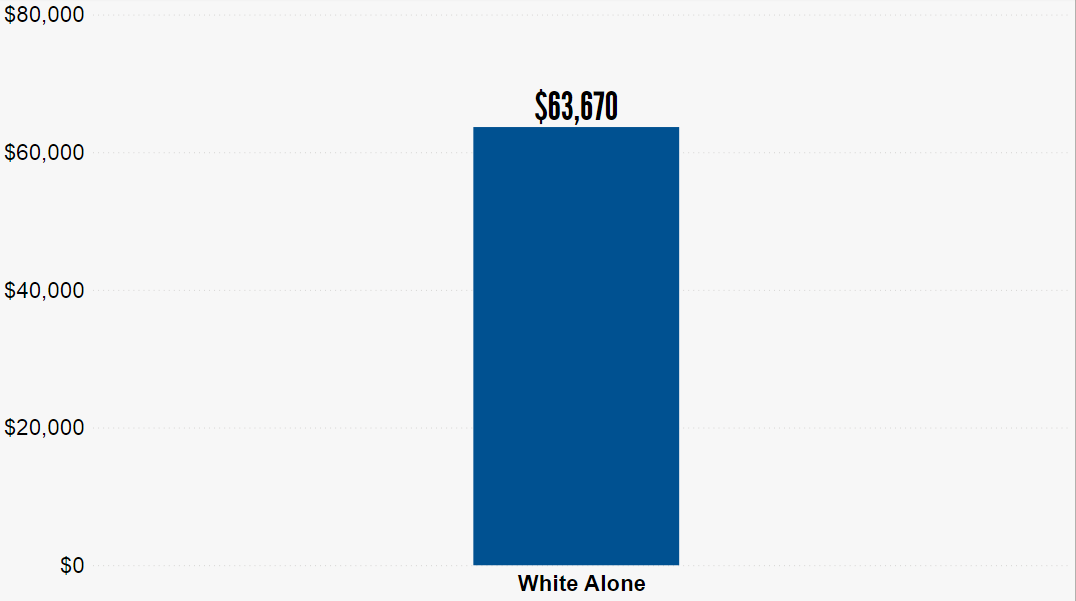
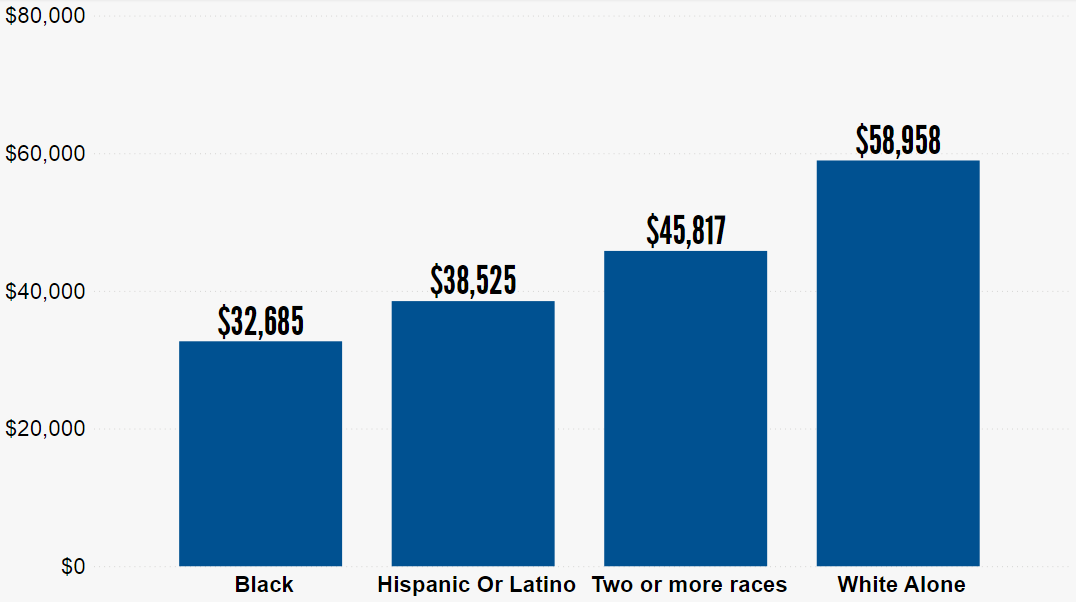
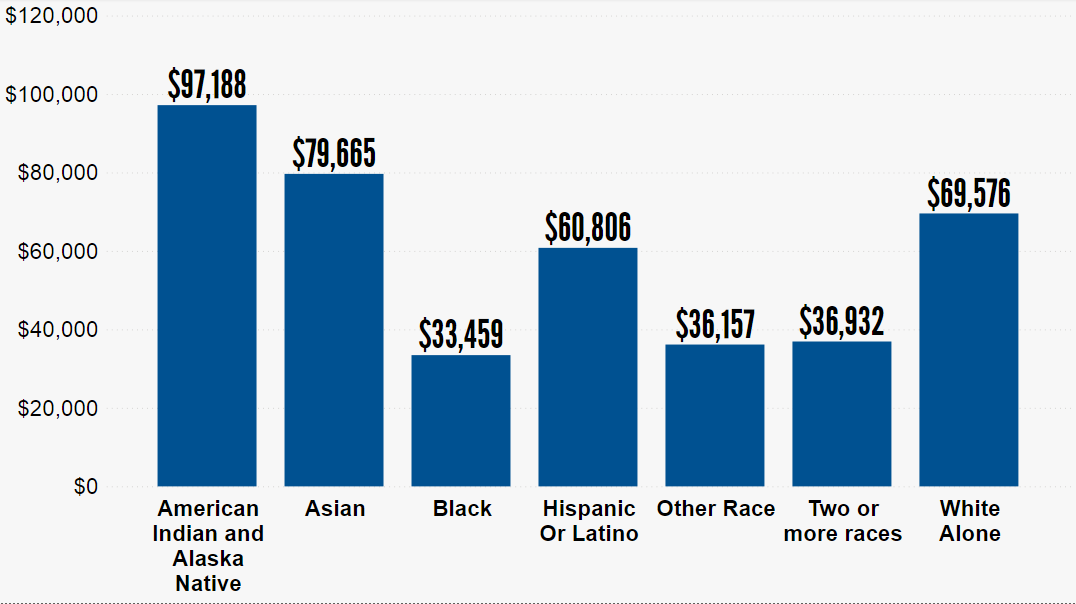
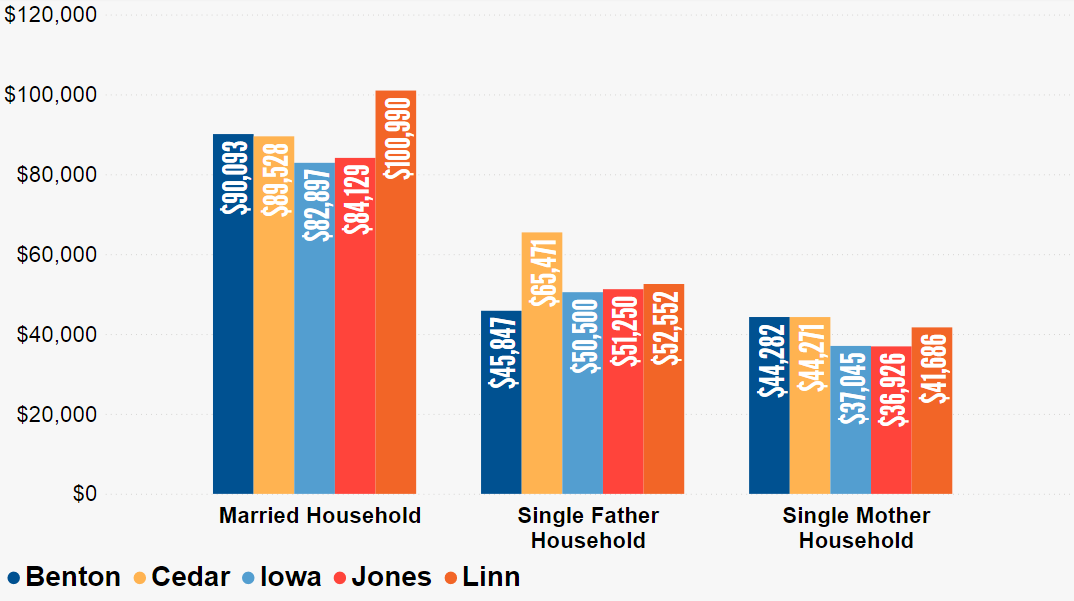
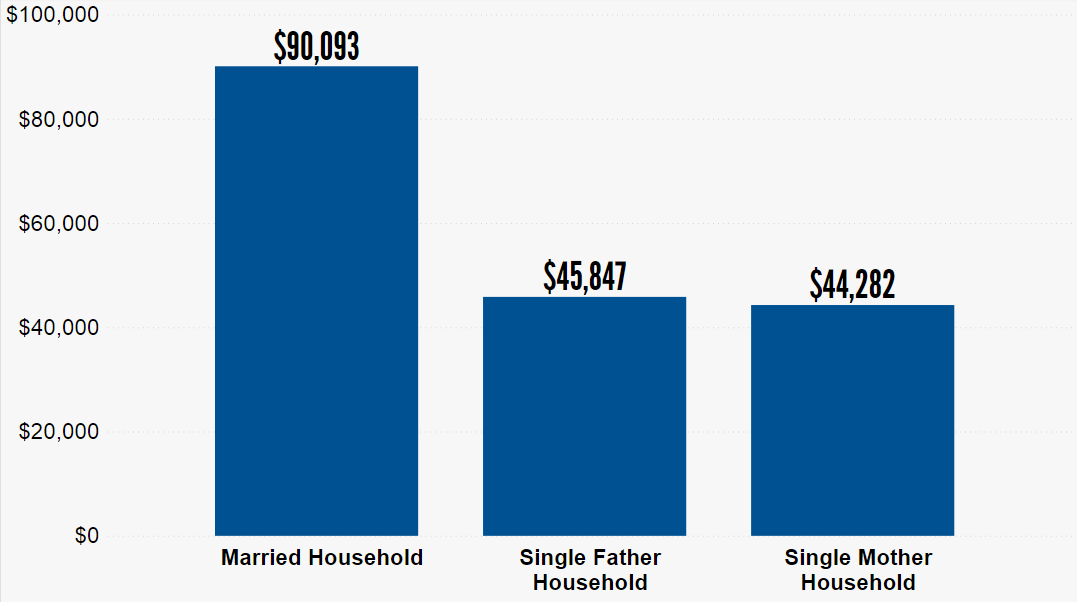
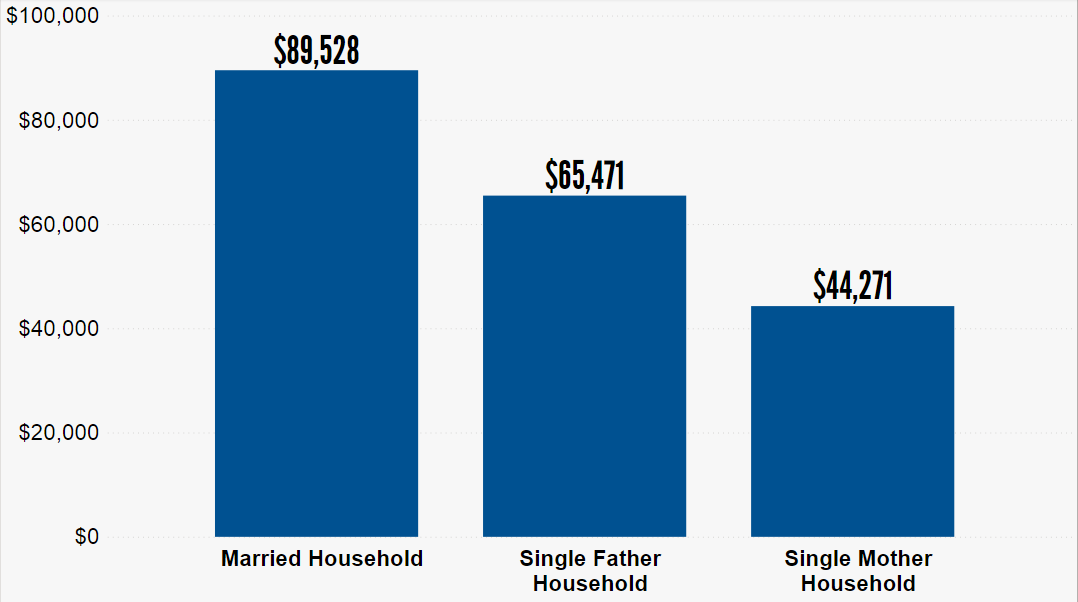
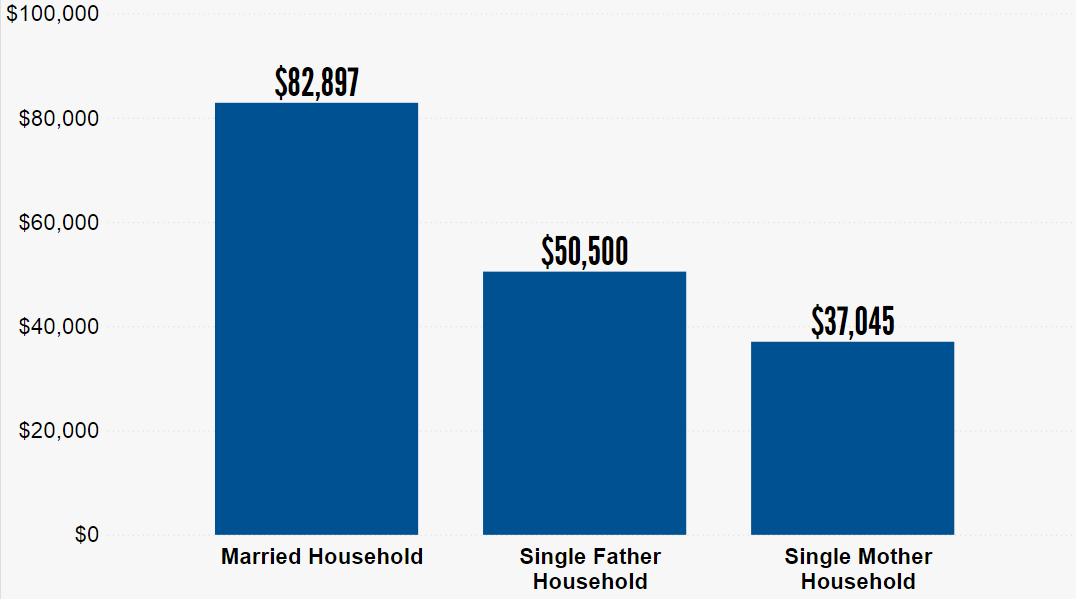
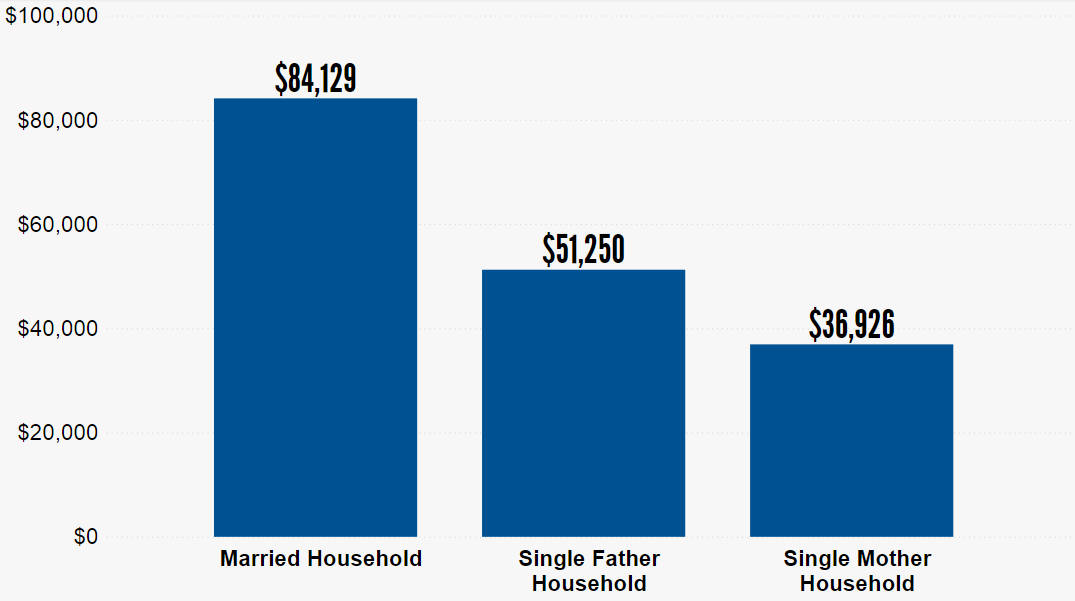
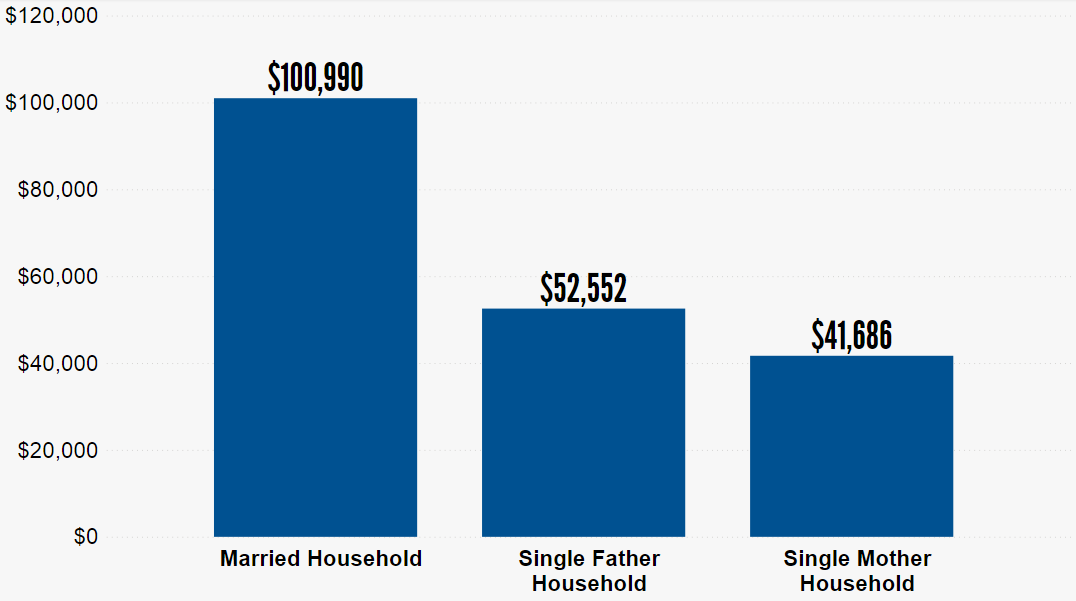
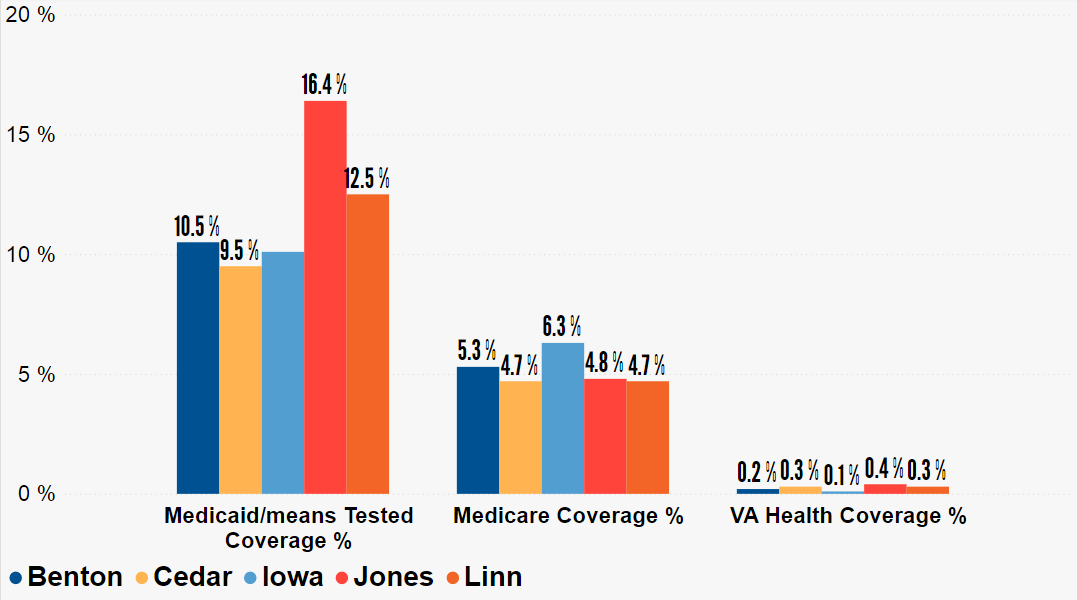
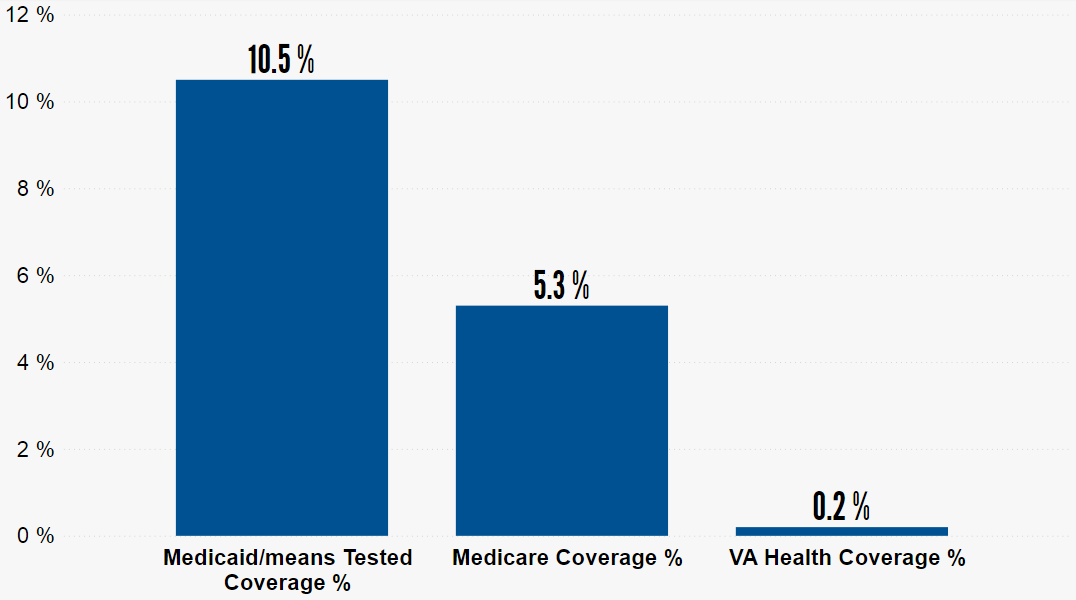
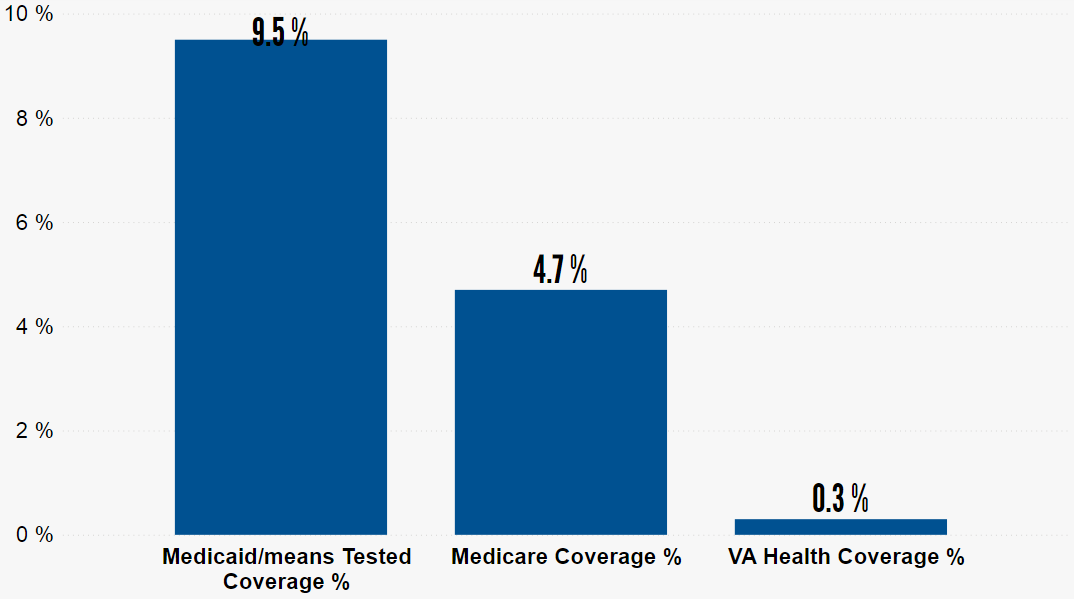
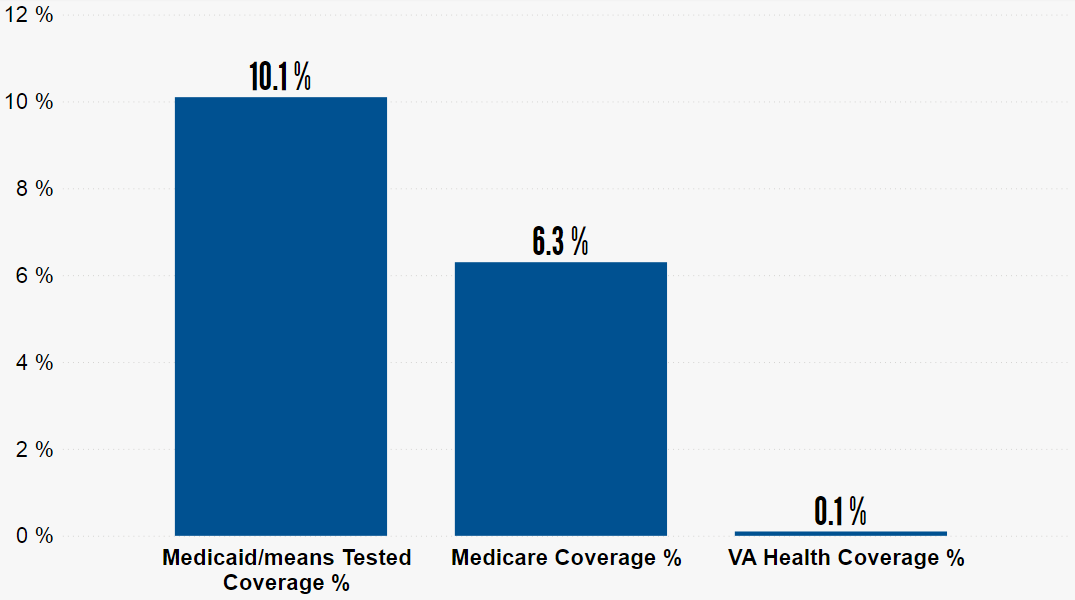
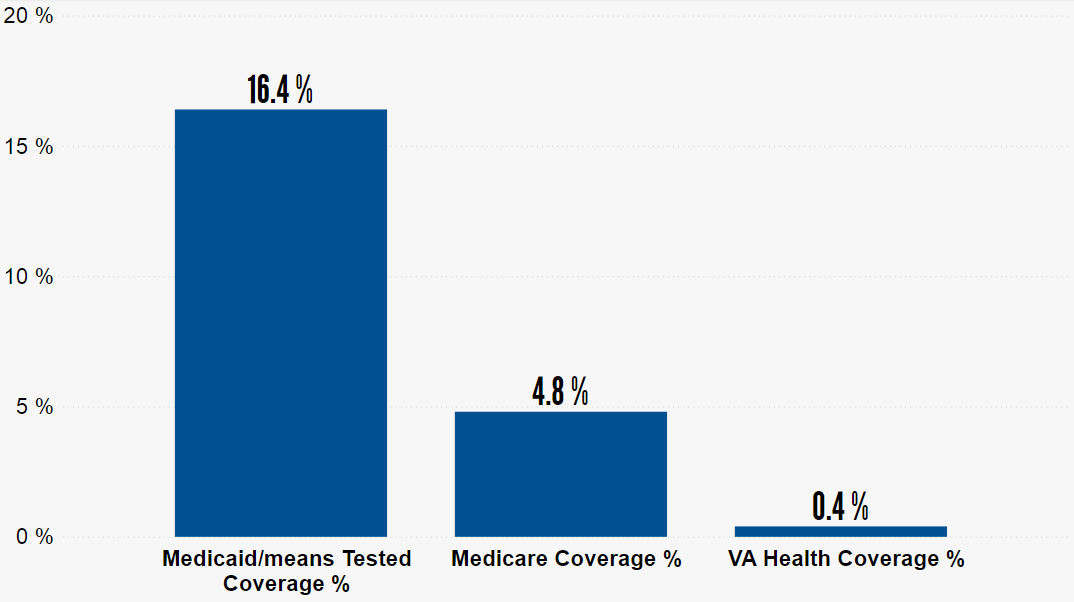
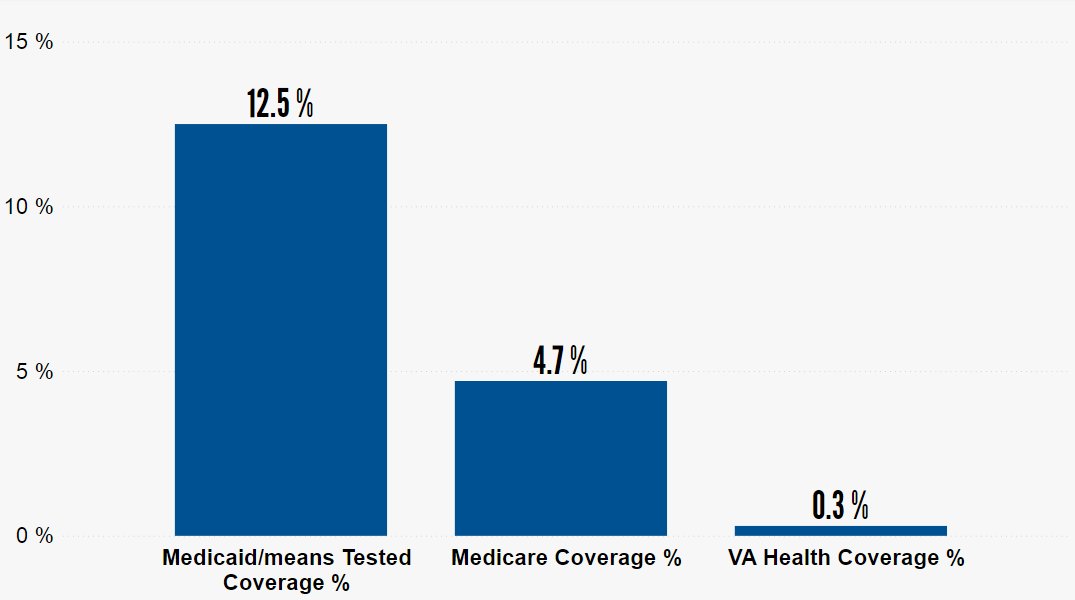
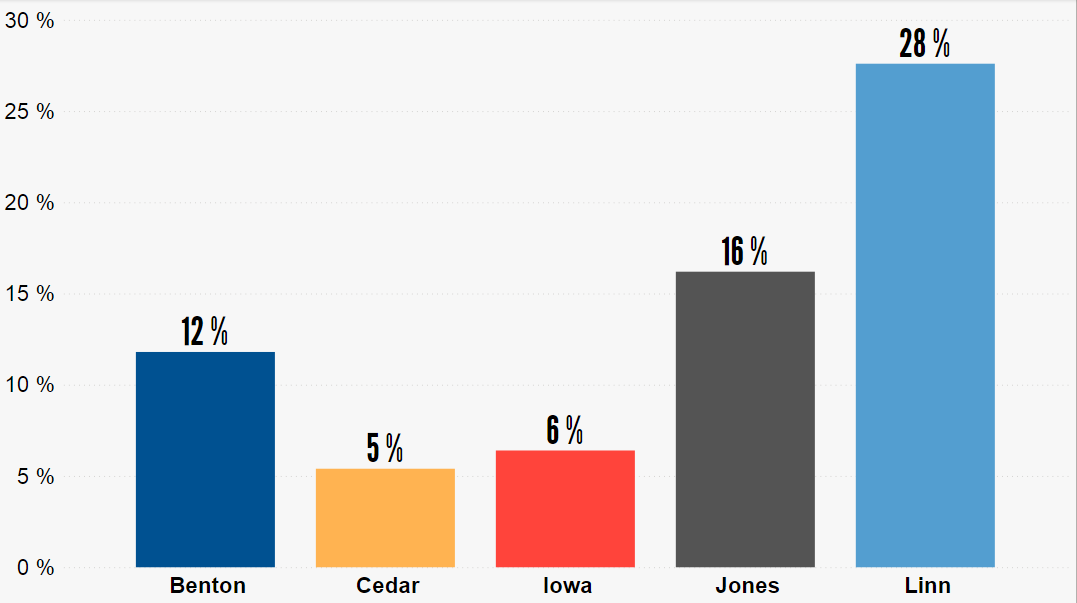
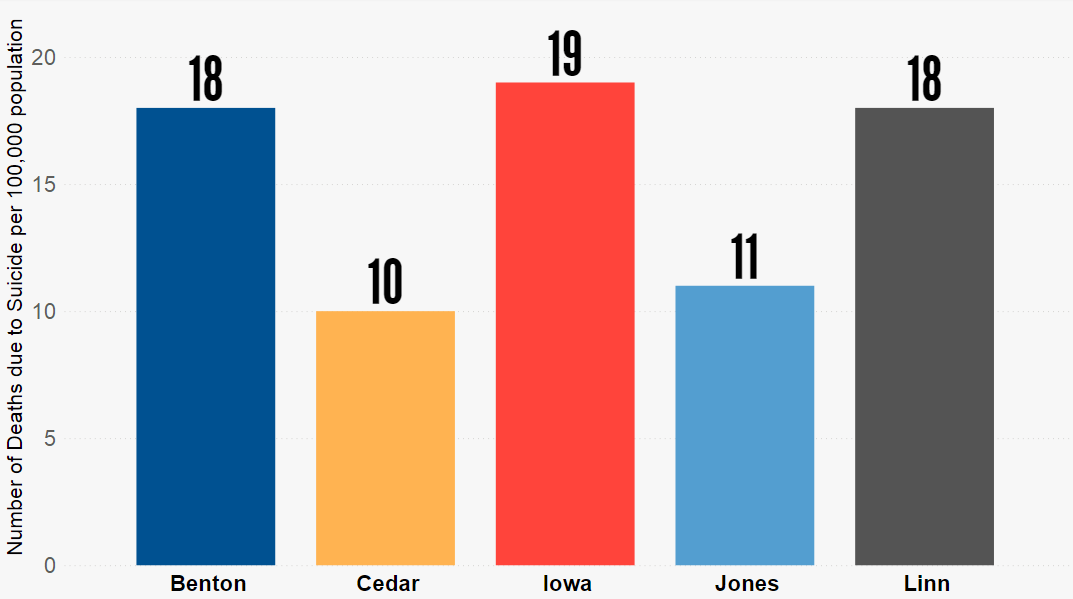
Food, shelter, transportation, and access to healthcare are just a few of many critical needs that are part of safety net services. We can see the disparities between groups of Eastern Iowans in these services below.
Food, shelter, transportation, and access to healthcare are just a few of many critical needs that are part of safety net services. We can see the disparities between groups of Eastern Iowans in these services below.
Tables used: S1702, S1903, S2301, B22008, S1501, S2704
The American Community Survey (ACS) is a US Census Bureau program that releases data ever year and therefore has more up-to-date data than the decennial census.
See the U.S. Census Bureau American Community Survey web site for a complete discussion of assumptions concerning ACS data.
United for ALICE, January 2022
ALICE, an acronym for Asset Limited, Income Constrained, Employed, is a new way of defining and understanding the struggles of households that earn above the Federal Poverty Level, but not enough to afford a bare-bones household budget.
ALICE is a collaborative effort between local United Ways and other nonprofits. Learn more about the ALICE Threshold.
2019 Iowa Department of Public Health via Kids Count
Percentage of children age 0-4 who are receiving services through the Women, Infants and Children Program.
Iowa Health Fact Book
The Iowa Health Face Book has been produced as a collaborative effort between The University of Iowa College of Public Health, Iowa Department of Public Health, and other interested partners working to improve the health of Iowans.